
数字图像的点运算
数字图像处理
(一)数字图像的点运算
原图:

一、数字图像的点运算
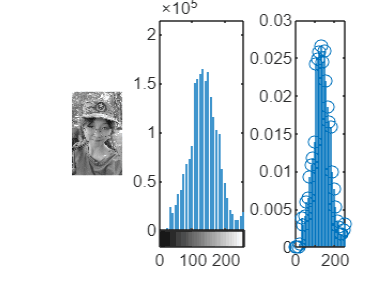
1.灰度直方图
1 | img=imread('C:\Users\24682\Desktop\lzy\face\lzy.jpg'); |
展示的效果如下图:
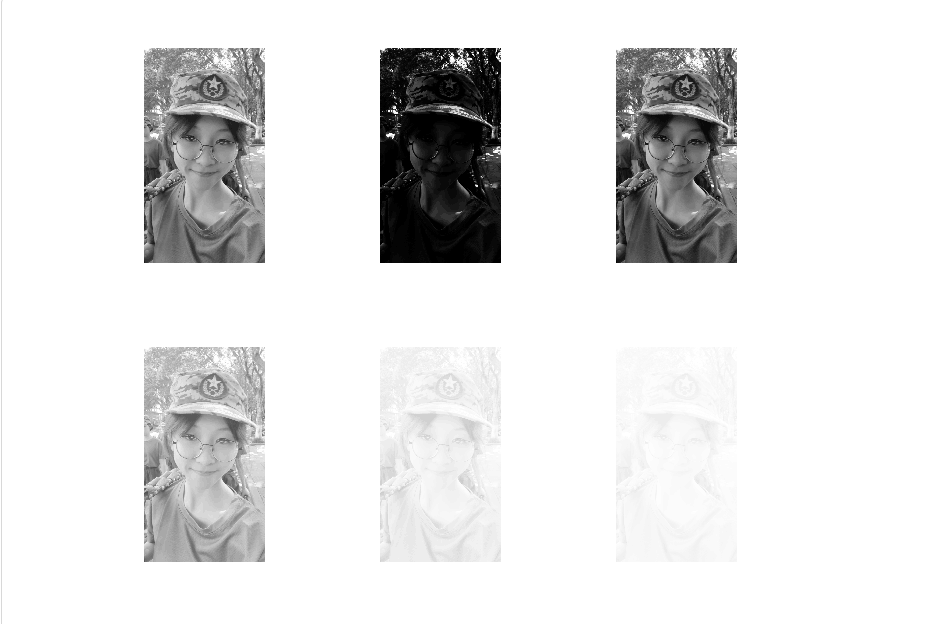
2.灰度线性变换
1 | img=imread('C:\Users\24682\Desktop\lzy\face\lzy.jpg'); |
展示的效果如下图:
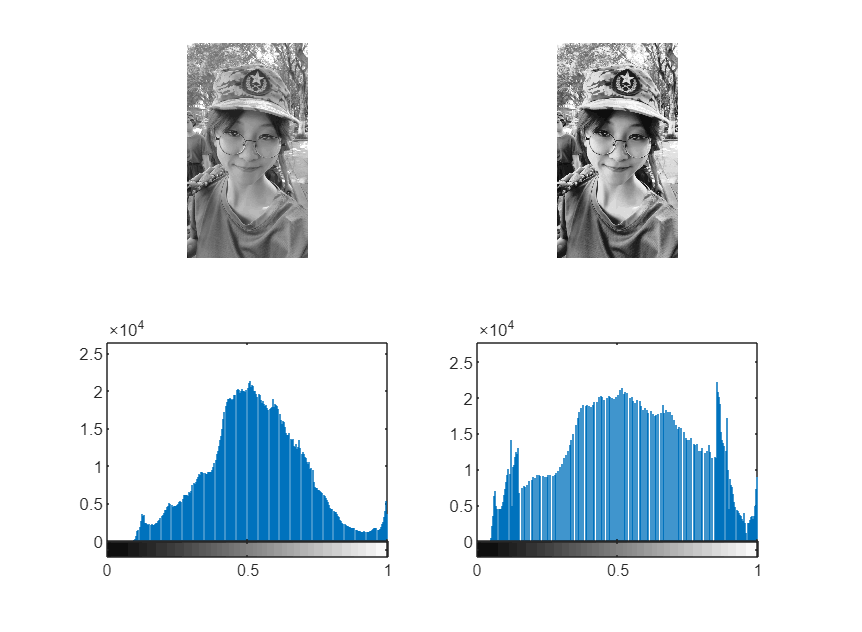
3.分段灰度线性变换
1 | I = imread('C:\Users\24682\Desktop\lzy\face\lzy.jpg'); |
4.灰度非线性变换
(1)对数变换
1 | img=imread('C:\Users\24682\Desktop\lzy\face\lzy.jpg'); |
(2) 伽马变换
1 | img=imread('C:\Users\24682\Desktop\lzy\face\lzy.jpg'); |
5.灰度阈值变换
灰度阙值变换可以将一幅灰度图像转换成黑白的二值图像。用户指定一个起到分界线作用的灰度值,如果图像中某像素的灰度值小于该灰度值,则将该像素的灰度值设置为0,否则设置为255;起到分界线作用的灰度值称为阈值,灰度的阈值变换也常被称为阈值化、或二值化。
1 | img=imread('C:\Users\24682\Desktop\lzy\face\lzy.jpg'); |
(二)图像的几何运算
1.图像平移
1 | function [J] = move(I,a,b) |
1 | A = imread('C:\Users\24682\Desktop\lzy\face\lzy.jpg'); |
2.图像镜像
1 | function [J] = mirror(I,n) |
1 | A = imread('C:\Users\24682\Desktop\lzy\face\lzy.jpg'); |
3.图像转置
1 | A = imread('C:\Users\24682\Desktop\lzy\face\lzy.jpg'); |
4.图像缩放
1 | A = imread('C:\Users\24682\Desktop\lzy\face\lzy.jpg'); |
1 | J3=imresize(I,0.5,'nearest'); |
5.图像旋转
1 | imread('C:\Users\24682\Desktop\lzy\face\lzy.jpg') |
